
A UK mid-market manufacturer we spoke to last quarter had spent £220k on a vendor MES-attached dashboard suite covering OEE, quality, and production dashboards across three plants. Twelve months in, the shift managers were not using the dashboards. They were still walking the floor, calling the line, and asking questions to make production decisions. The dashboards existed, contained accurate data, and were technically functional. They just were not part of how shift managers actually made decisions.
The operations director asked why. The honest answer was that the dashboards had been designed by the vendor's standard templates and configured by IT, without involving shift managers in the design process. The dashboards showed the KPIs that vendor templates prioritised, arranged in the way vendor templates arranged them, refreshed at the frequency vendor defaults specified. That combination did not match how shift managers actually thought about their shifts or made in-shift decisions.
We ran a 3-week engagement with shift managers watching them make decisions and asking what information they wished they had. Then we rebuilt the OEE and production dashboards to match the questions shift managers actually asked (which lines are behind schedule right now, what specific bottleneck is causing it, what changes would recover the shift plan, when does the next planned changeover happen). Kept the vendor platform as the data source; changed the dashboard presentation and interaction to match how shift managers actually worked.
Six weeks later, shift managers were using the dashboards constantly. In-shift decision quality improved noticeably. Production planning accuracy improved. Cost: £42k custom dashboard development on top of the existing vendor platform. Value: £220k platform investment that was previously delivering compliance theatre now delivered operational ROI.
That is the manufacturing dashboard software 2026 conversation across UK and US manufacturers. Dashboards designed by vendors, configured by IT, and delivered to operations teams without operations involvement consistently fail adoption regardless of platform quality. Dashboards designed with the operations team they serve consistently succeed regardless of platform. The dashboard question is about user adoption and workflow fit, not primarily about technology.
This article is a candid guide for UK and US manufacturing operations, IT, and leadership scoping manufacturing dashboard and analytics software. Five dashboard categories. Build vs buy vs configure. Real cost bands. Integration reality. What actually gets adopted. What we learned building real-time operations dashboards that share the technical DNA manufacturing dashboards require.
The Five Practical Manufacturing Dashboard Categories in 2026
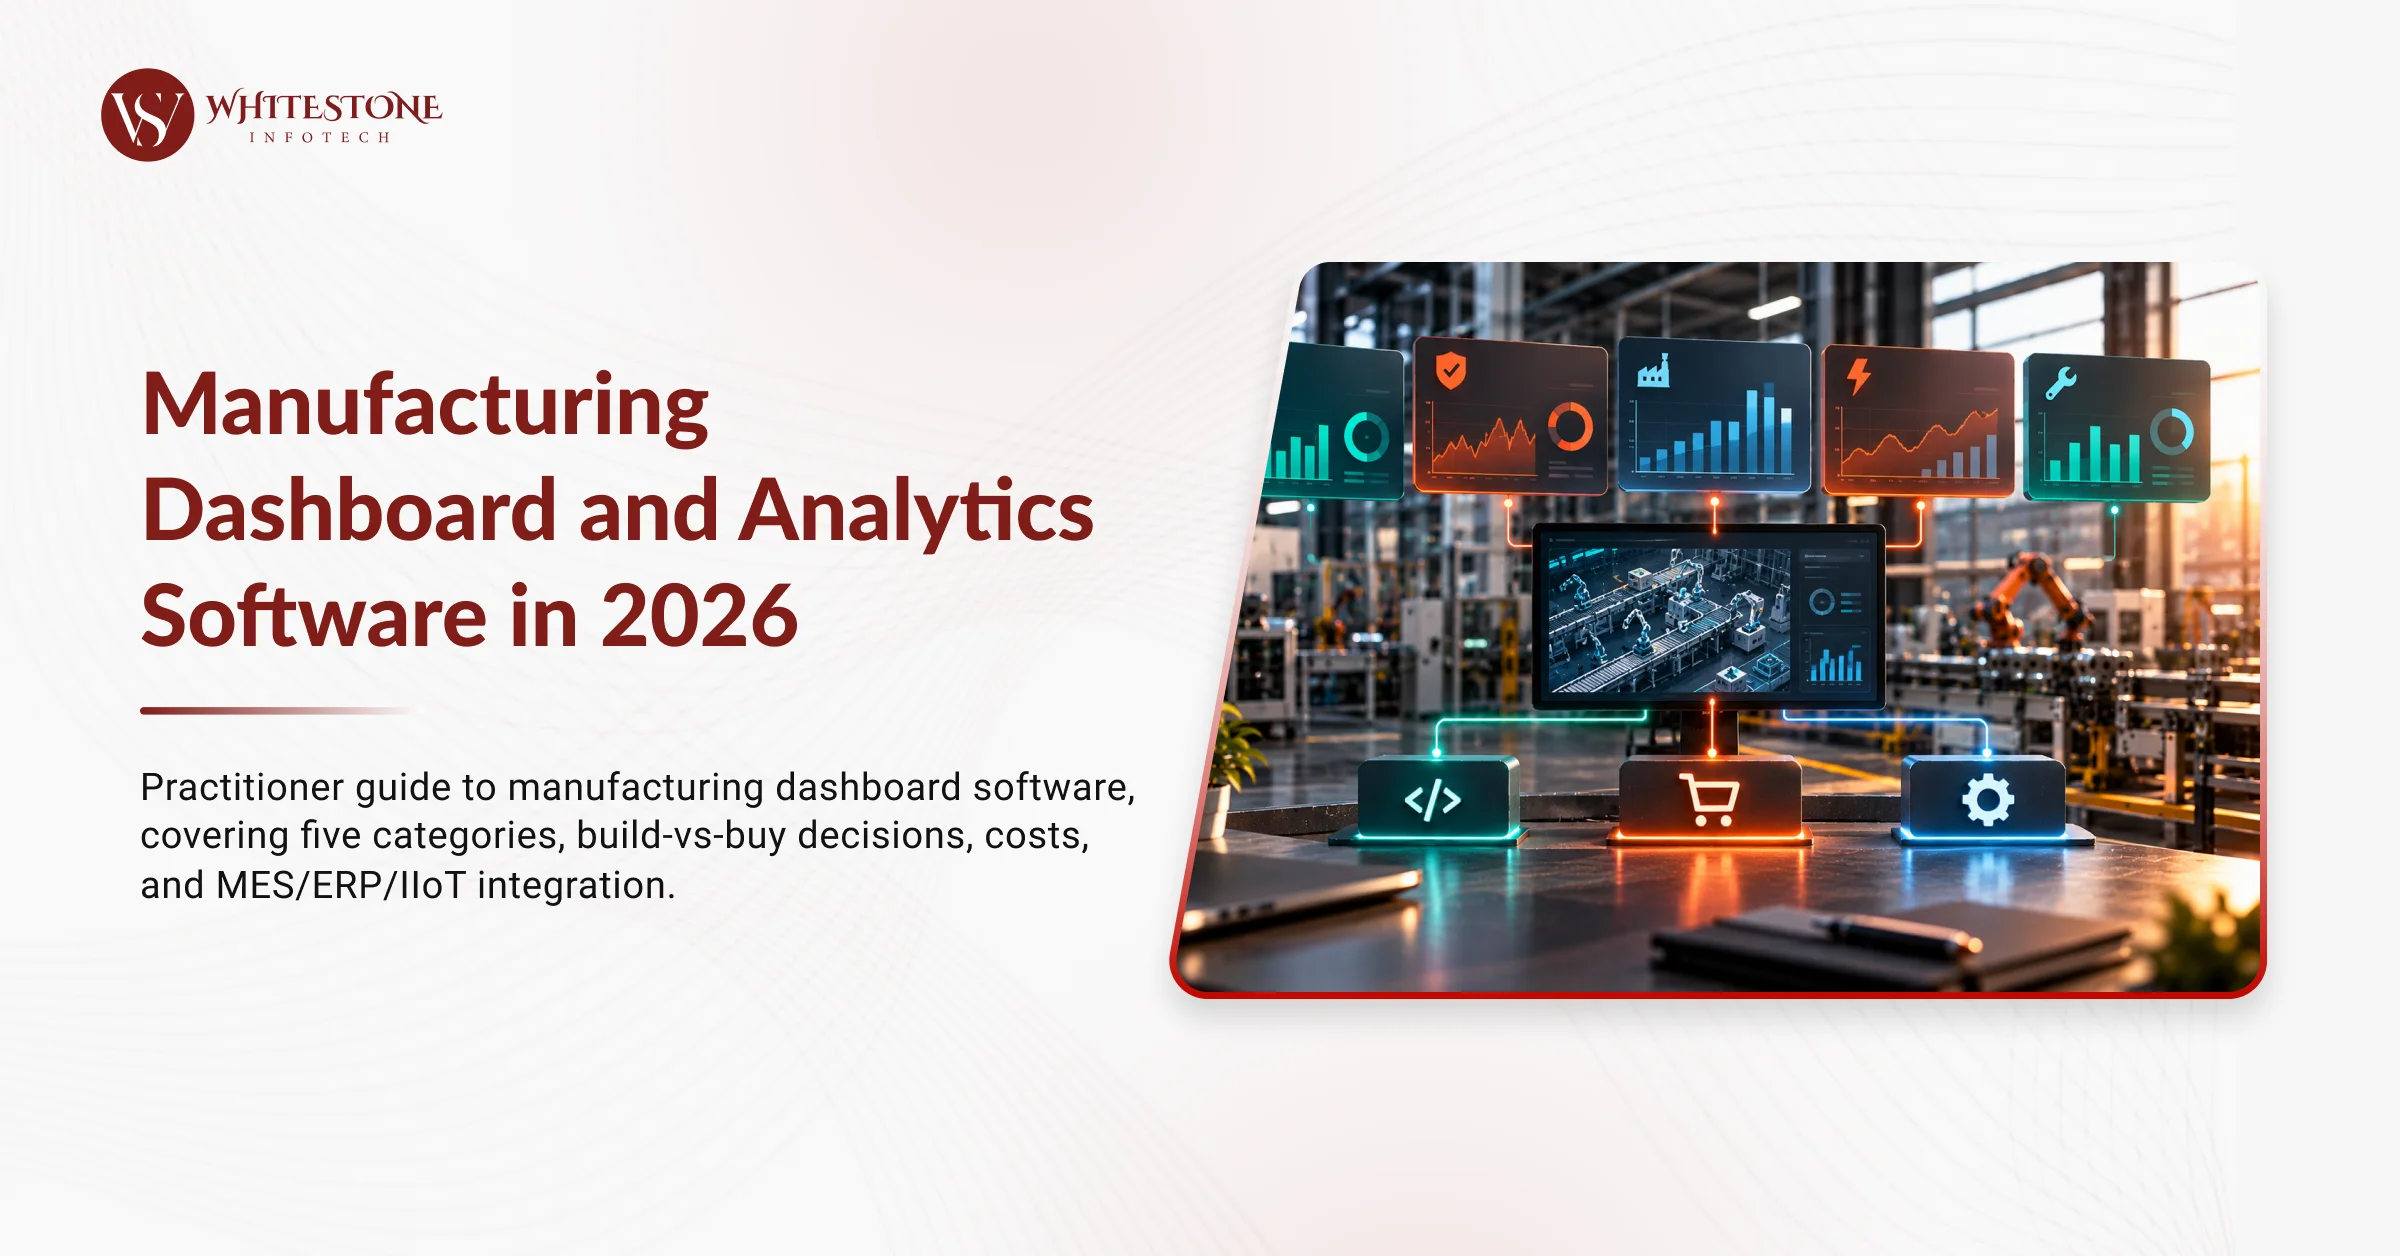
Category 1: OEE dashboards. Availability, performance, quality metrics with real-time (per-minute) and shift-level views. Audience: operators, shift managers, production managers. Refresh: real-time to per-minute. Best for shift-level decision making and continuous improvement.
Category 2: Quality dashboards. First-pass yield, defect trending, quality holds, statistical process control charts, non-conformance trending. Audience: quality teams, production managers, quality engineers. Refresh: real-time for SPC charts, hourly or daily for trending. Best for quality decisions and continuous improvement.
Category 3: Production dashboards. Throughput vs plan, work-in-progress, schedule adherence, bottleneck identification, changeover status. Audience: production managers, planners, operations directors. Refresh: real-time for throughput, hourly or shift-level for schedule adherence. Best for production planning and coordination.
Category 4: Energy dashboards. kWh per unit produced, energy cost per output, peak demand tracking, sustainability KPIs. Audience: energy managers, sustainability teams, operations directors. Refresh: hourly or daily. Best for energy cost optimisation and sustainability reporting.
Category 5: Maintenance dashboards. MTBF, MTTR, maintenance backlog, PdM alerts, planned maintenance schedule. Audience: maintenance teams, maintenance managers, reliability engineers. Refresh: real-time for alerts, daily for backlog and metrics. Best for maintenance decisions and reliability improvement.
Per MESA International 2026 manufacturing metrics guidance and Made Smarter UK adoption research, the manufacturers reporting strongest dashboard ROI in 2026 consistently design dashboards with the operations teams they serve rather than deploying vendor templates unchanged; workflow-fit design matters more than dashboard technology choice.
Build vs Buy vs Configure Decision
Build custom when.
Specific competitive KPIs or analytics not available in vendor platforms
Deep integration with proprietary process models or industry-specific quality algorithms
Data ownership and sovereignty matter (regulatory, IP protection, competitive)
Team has software engineering capacity or external development capacity
Ongoing dashboard evolution matters (weekly or monthly changes to KPIs and interactions)
Realistic expectation: £120k-£600k initial build for a custom dashboard suite. 6-12 months timeline. Higher ongoing engineering cost. Full control over dashboard evolution.
Buy vendor platform (Siemens Opcenter, PTC ThingWorx, Rockwell FactoryTalk InnovationSuite, GE Predix, Aveva OSIsoft) when.
Standard manufacturing dashboards (OEE, quality, production, maintenance)
Existing vendor relationship (Siemens shop with existing Siemens equipment) provides natural integration
Team lacks software engineering capacity
Annual licence £60k-£400k+ fits budget
Integration with existing MES and ERP is standard
Realistic expectation: annual licence £60k-£400k+ plus initial integration £80k-£400k+. Fast time-to-value on standard dashboards. Limited customisation beyond vendor extension points. Dashboard fit depends heavily on adoption support and template customisation.
Configure BI tool (Power BI, Tableau, Looker, Qlik) with manufacturing data model when.
Data sources are already accessible (MES, ERP, IIoT platform expose data)
Team has BI capacity but not software engineering capacity
Dashboards are informational (management reporting, executive summaries) rather than operational
Refresh cadence is hourly or daily rather than real-time
Cost sensitivity on dashboard tooling
Realistic expectation: BI tool licence £15-£70 per user monthly plus data model development £30k-£200k. Best for informational dashboards; poor fit for real-time operational dashboards where BI tool refresh limitations matter.
What Operations Teams Actually Use
Dashboards that consistently get adopted share four characteristics.
Design with the operations team it serves. Dashboards designed with input from the operators, shift managers, production managers, or maintenance teams who will use them consistently get adopted. Dashboards designed by IT or by vendors without user involvement consistently do not.
Answer the questions users actually ask. Users ask specific questions ("which line is behind schedule right now"), not KPI abstractions ("what is our OEE"). Dashboards that visibly answer specific questions get used; dashboards that present KPI abstractions without answering questions get ignored.
Match refresh frequency to decision frequency. Real-time dashboards for real-time decisions (shift-level bottleneck identification). Daily dashboards for daily decisions (planning, maintenance backlog). Weekly dashboards for weekly decisions (continuous improvement projects). Mismatch (real-time for weekly decisions, weekly for real-time) hurts adoption.
Fit into existing workflow and tools. Dashboards accessed on devices users already use (shop floor tablets, control room displays, mobile phones during floor walks) get used. Dashboards requiring users to change device or workflow to access get ignored.
Real 2026 Cost Bands
Deployment scale | Custom build initial | Custom annual | Vendor platform (annual all-in) | BI tool configure |
Small (5-15 dashboards, single site) | £120k-£400k | £30k-£90k | £60k-£240k | £30k-£120k initial + £15k-£50k annually |
Mid-market (15-40 dashboards, multi-line or multi-site) | £400k-£1.2m | £90k-£280k | £240k-£720k | £120k-£400k initial + £40k-£140k annually |
Enterprise (40+ dashboards, multi-site) | £1.2m-£4m+ | £280k-£900k+ | £720k-£2m+ | £400k-£1m+ initial + £140k-£400k+ annually |
Two rules that hold at every scale. Adoption support cost (user workshops, workflow design, training, iteration based on user feedback) is typically 15-25 percent of total dashboard cost and consistently under-scoped. And integration cost with MES, ERP, IIoT, and QMS is typically 25-40 percent of total dashboard cost; underestimating this creates the pattern of dashboards existing but not being used because data flow is unreliable.
Integration with MES, ERP, IIoT, and QMS
Six integration patterns that determine whether dashboards deliver operational value.
MES to dashboards for production and quality events. Real-time production events feed OEE, production, and quality dashboards. Must match specific MES event schema.
ERP to dashboards for work orders and schedule. Work order status, schedule, material availability feed production dashboards. Must match specific ERP data model.
IIoT to dashboards for real-time sensor and machine data. IIoT platform data feeds real-time OEE and equipment condition dashboards. Must match IIoT platform data schema.
QMS to dashboards for non-conformance and CAPA. Quality management data feeds quality dashboards and CAPA tracking. Must match QMS data model.
HR to dashboards for labour metrics. HR data feeds labour productivity and skill matrix dashboards. Requires HR-operations data integration that many manufacturers lack.
Finance to dashboards for cost per unit and margin. Finance data (labour cost, material cost, overhead allocation) feeds cost per unit and margin dashboards. Requires finance-operations data integration that many manufacturers lack.
Common Failure Modes
Deploying vendor dashboard templates without user involvement. Team deploys vendor MES-attached dashboards using default templates. Operations teams do not adopt because templates do not match how they think about their operations. Fix: user involvement in dashboard design from day one; customise vendor templates to match user workflow.
Building custom dashboards without workflow research. Team builds custom dashboards based on IT's understanding of what operations should want. Operations teams do not adopt because dashboards do not answer questions they actually ask. Fix: workflow research (watching operators, shift managers, production managers make decisions) before dashboard design.
Using BI tools for real-time operational dashboards. Team configures Power BI or Tableau for real-time factory dashboards. BI tool refresh cadence (typically hourly or slower) does not match real-time decision needs. Fix: BI tools for informational and management dashboards; purpose-built or custom solutions for real-time operational dashboards.
Ignoring integration reliability. Team ships dashboards with data pipelines that break intermittently. Operations teams lose trust when data appears wrong or missing. Fix: integration reliability engineering (monitoring, alerting, data quality checks) as first-class requirement, not afterthought.
Building dashboards for reporting rather than operations. Team builds dashboards that meet executive reporting requirements but do not help operations teams make decisions. Dashboards get built and used only for monthly reports; daily operations continues on the old approach. Fix: separate operational dashboards (used daily by operations teams) from executive reporting (used monthly for management view).
Under-investing in adoption support. Team ships dashboards without user workshops, training, iteration based on feedback, or dedicated adoption support. Users try dashboards once, find them awkward, do not return. Fix: budget 15-25 percent of total dashboard cost for adoption support.
What We Learned Building Real-Time Operations Dashboards
WhiteStone has shipped TrackVid operations dashboards (real-time visibility into packing quality, dispute status, and merchant performance for 4000+ Indian ecommerce merchants) and SiteFlow field operations dashboards (real-time visibility into worker location, equipment status, and site progress for UK property developer field operations). Both share the technical DNA manufacturing dashboards require. Three lessons transfer to any UK or US manufacturer scoping dashboard software.
User workflow research before design determines adoption. TrackVid dashboards work because we watched merchants use packing operations before designing the dashboards, and the dashboards answer the questions merchants actually ask during their operations. Same for SiteFlow: we watched site managers do site walks before designing the field operations dashboard. Same discipline applies to manufacturing: watch operations teams before designing dashboards for them.
Real-time reliability matters more than dashboard sophistication. TrackVid dashboards succeeded because data pipelines are reliable and dashboards show accurate current data. SiteFlow dashboards succeeded for the same reason. Manufacturing dashboards that show unreliable data lose user trust rapidly. Real-time reliability engineering (monitoring, alerting, graceful degradation) matters more than dashboard visual sophistication.
Integration with existing tools and devices determines usage. TrackVid dashboards are used on the devices merchants already use during operations. SiteFlow dashboards work on the mobile devices site managers already carry. Manufacturing dashboards that require operations teams to change device or workflow to access consistently under-deliver on adoption.
See our portfolio of shipped work for real-time operations dashboard case studies. For a scoped manufacturing dashboard conversation, book a manufacturing software call with WhiteStone.
Frequently Asked Questions
What is manufacturing dashboard software and what does it do in 2026?
Manufacturing dashboard software presents production, quality, energy, maintenance, and OEE metrics in real-time or shift-level views for operators, shift managers, production managers, and executives. In 2026 it spans five categories (OEE, quality, production, energy, maintenance dashboards) and integrates with MES, ERP, IIoT platform, QMS, HR, and finance data sources. Delivers value when used by operations teams in daily decisions; delivers compliance theatre when built for reporting without operations adoption.
What KPIs should a manufacturing dashboard track in 2026?
Five KPI categories. OEE (availability, performance, quality). Quality (first-pass yield, defect rate, quality holds, SPC). Production (throughput, WIP, schedule adherence, bottlenecks). Energy (kWh per unit, energy cost per output, peak demand). Maintenance (MTBF, MTTR, backlog, PdM alerts). Specific KPIs within each category depend on manufacturing process; operations team involvement in KPI selection matters more than industry-standard KPI list.
Should manufacturers build or buy dashboard software?
Build custom when specific competitive KPIs or analytics matter, deep integration with proprietary models required, data ownership matters, team has engineering capacity. Buy vendor platform (Siemens Opcenter, PTC ThingWorx, Rockwell FactoryTalk, GE Predix, Aveva OSIsoft) for standard dashboards with existing vendor relationship. Configure BI tool (Power BI, Tableau, Looker, Qlik) for informational dashboards where data sources already accessible and team has BI capacity but not engineering capacity.
How much does manufacturing dashboard software cost in 2026?
Small deployment (5-15 dashboards, single site): custom £120k-£400k + £30k-£90k annually, vendor platform £60k-£240k annually all-in, BI configure £30k-£120k initial + £15k-£50k annually. Mid-market: custom £400k-£1.2m + £90k-£280k annually, vendor £240k-£720k, BI £120k-£400k initial + £40k-£140k annually. Enterprise: custom £1.2m-£4m+, vendor £720k-£2m+. Adoption support cost typically 15-25 percent of total; integration 25-40 percent.
How does manufacturing dashboard software integrate with MES, ERP, and IIoT?
Six integration patterns. MES to dashboards for production and quality events. ERP to dashboards for work orders and schedule. IIoT to dashboards for real-time sensor and machine data. QMS to dashboards for non-conformance and CAPA. HR to dashboards for labour metrics. Finance to dashboards for cost per unit and margin. Integration must match specific data schema; standard vendor connectors rarely match specific manufacturer processes.
What are the common manufacturing dashboard failure modes?
Six recurring failure modes. Deploying vendor templates without user involvement. Building custom dashboards without workflow research. Using BI tools for real-time operational dashboards (refresh cadence mismatch). Ignoring integration reliability (data pipeline breakage). Building for reporting rather than operations. Under-investing in adoption support (workshops, training, iteration).
Why choose WhiteStone Infotech for manufacturing dashboard software?
We build real-time operations dashboards that share manufacturing dashboard DNA. TrackVid operations dashboards deliver real-time visibility into packing quality and dispute status for 4000+ Indian ecommerce merchants. SiteFlow field operations dashboards track worker location, equipment status, and site progress for a UK property developer. Both required the discipline manufacturing dashboards require: user workflow research before design, real-time data pipeline reliability, and integration with devices and tools users already use. Contact WhiteStone Infotech at whitestoneinfotech.com/contact.
The One Thing to Remember
Manufacturing dashboard software in 2026 spans five practical categories (OEE, quality, production, energy, maintenance dashboards), each with distinct KPIs, refresh frequency, and audience. Custom build for specific competitive analytics and deep integration (£120k-£400k small, £400k-£1.2m mid-market, £1.2m-£4m+ enterprise). Vendor platforms (Siemens Opcenter, PTC ThingWorx, Rockwell FactoryTalk, GE Predix, Aveva OSIsoft) for standard dashboards with existing vendor relationship (£60k-£720k+ annually all-in). BI tools (Power BI, Tableau, Looker, Qlik) for informational dashboards where data sources already accessible. Adoption support 15-25 percent of total; integration 25-40 percent. The single decision that determines dashboard ROI: does the dashboard get used by the operations team in their daily decisions, or does it sit unused because it does not match workflow? Dashboards designed with operations teams consistently get adopted; dashboards deployed by IT or vendors without operations involvement consistently do not. Adoption matters more than technology choice.
.webp)